
Dashboards/Power BI
IT Partners creates and manages data visualizations for Gies units through the Microsoft Power BI service. Our visualizations and reports present relevant data in ways that meet your needs and allow you to explore your data in new ways.
How do I access the Power BI service?
All UIUC faculty and staff can access Power BI at https://app.powerbi.com/. There are multiple ways to share dashboards and reports in Power BI. IT Partners shares all dashboards and reports via Power BI Apps.
After signing in, locate the My Apps tab where your dashboard apps are listed.
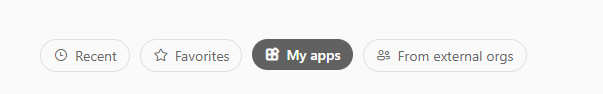
You will only have access to those apps that have been provisioned to you. Related dashboards/reports may be bundled into a single Power BI app.
How often are dashboards updated?
Gies data dashboards are updated according to a regular schedule, depending on the level of need for fresh data. Some dashboards refresh multiple times a day, others only once a semester. Some are point-in-time snapshots. Rest assured, you'll have the most recent relevant data available.
How do I request a new dashboard?
Our Data Strategy, Analytics, and Reporting group is responsible for working with you to identify your needs for new data dashboards. You can start the process by working with your unit's assigned data analyst. If you don't know your data analyst yet, just submit a Help Desk request and we'll connect you.